A learning tool that shows the difference between rendering strategies (CSR · SSR · SSG · ISR · Streaming SSR + RSC) as motion on a timeline instead of prose. Requests, responses, paints and hydration flow across browser, network and server lanes, and TTFB · FCP · LCP · TTI land as flags on the same time axis. Change a parameter and the flags move immediately.
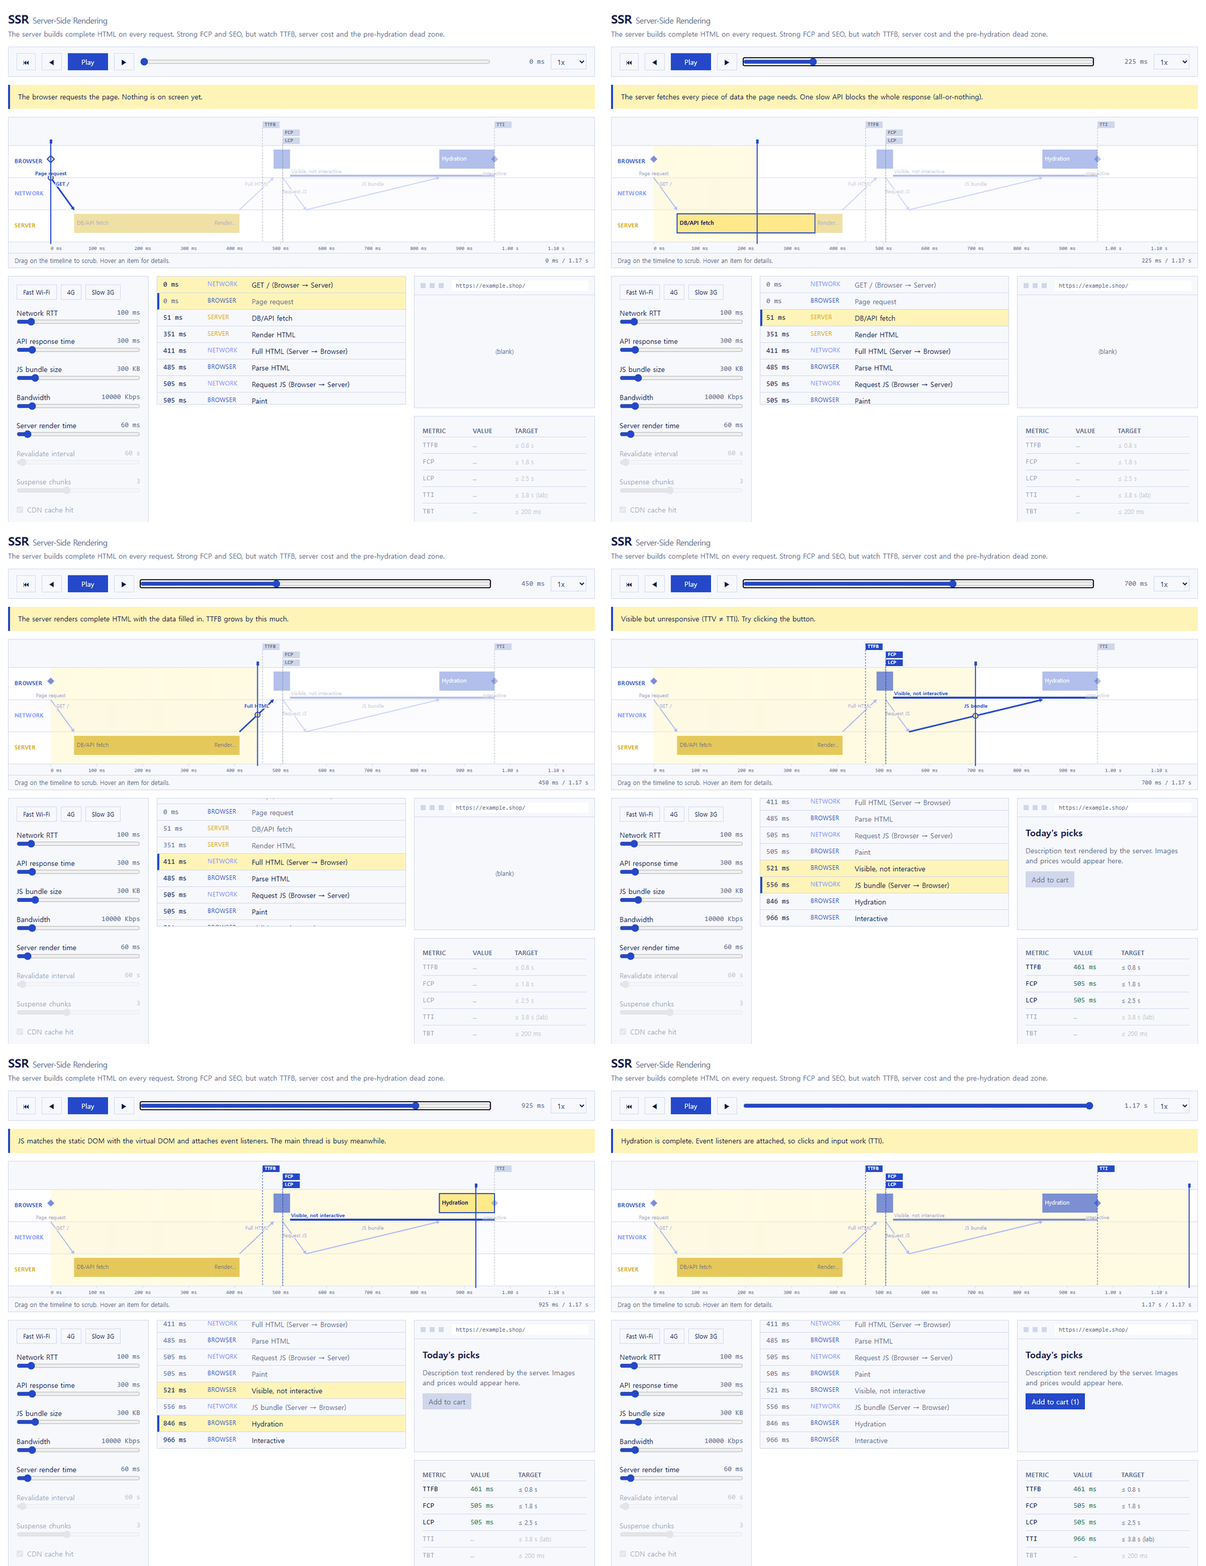
What you can see
- Three-lane timeline — packets (request, HTML, JS, JSON, RSC chunks) cross between lanes, and the work on each lane (server render, parse, paint, hydration) shows as bars. Metric flags, a time cursor and drag-to-scrub are built in.
- Virtual browser window — blank → skeleton → content → interactive. Click the button before hydration finishes and nothing happens: the "visible but unusable" gap, felt first-hand.
- Metrics panel — TTFB · FCP · LCP · TTI · TBT, color-coded against the recommended thresholds.
- Parameter panel — network RTT, API response time, JS bundle size, bandwidth, server render time, CDN cache hit, revalidate interval, Suspense chunk count. Fast Wi-Fi / 4G / Slow 3G presets. Values live in the URL, so any state is shareable as a link.
- Step-by-step narration — play · pause · step · speed (0.25x to 4x). Each step explains in one line what is happening right now.
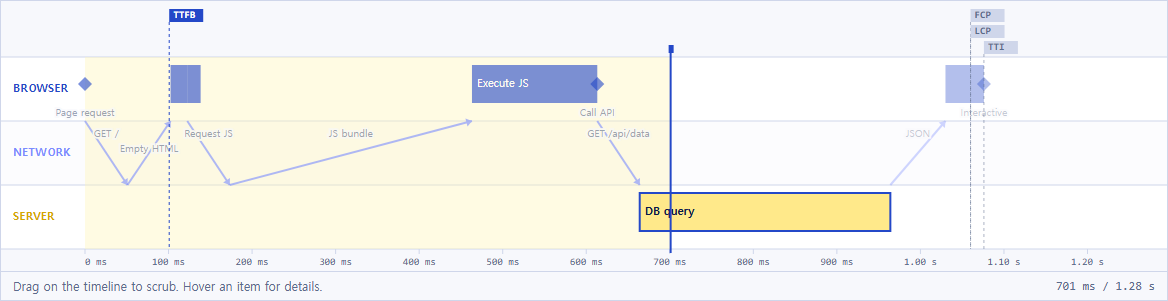
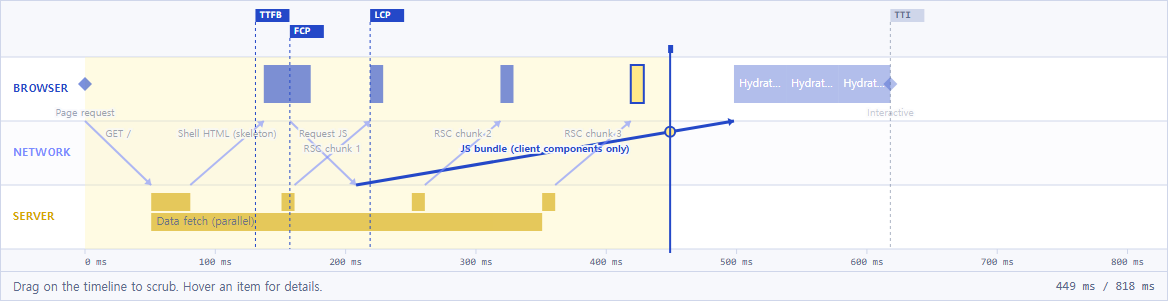
| CSR: empty HTML, then a long JS download and an API call | Streaming SSR + RSC: shell first, chunks as they resolve |
|---|
 |  |
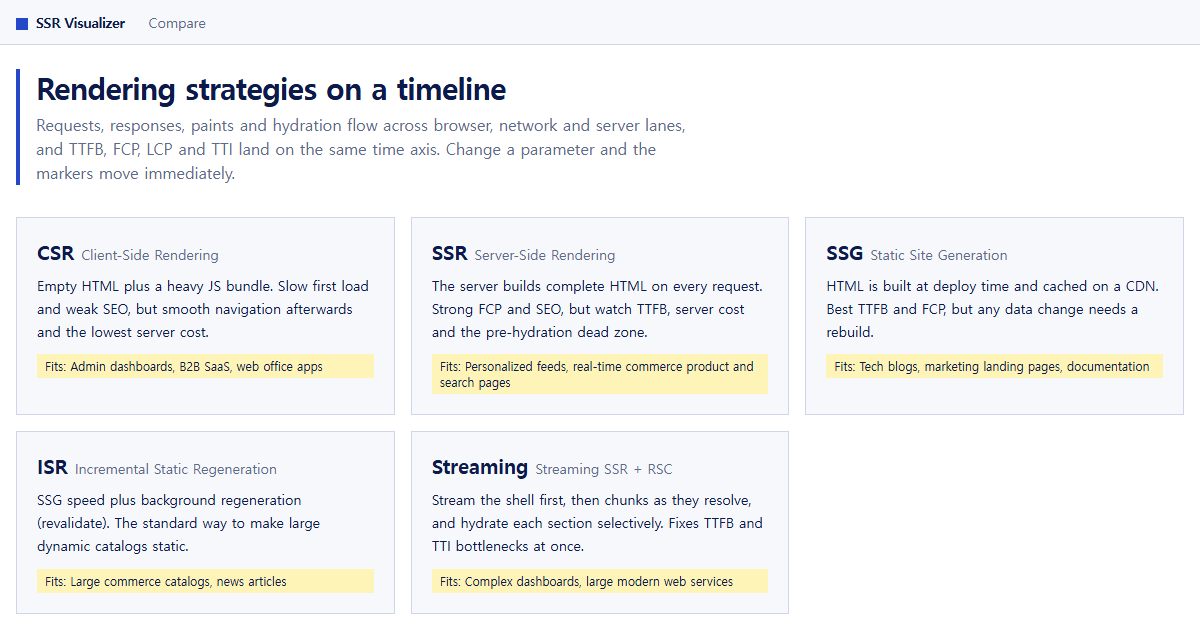
The five modes
| Mode | One-liner | What stands out on the timeline |
|---|
| CSR | Empty HTML + big JS bundle | Fastest TTFB but slowest FCP. One more API round trip after the JS runs |
| SSR | The server builds complete HTML on every request | TTFB slips by the server fetch time. The page shows early but cannot be clicked until hydration |
| SSG | HTML built at deploy time, served from a CDN | Shortest TTFB and FCP on a cache hit. Any data change needs a rebuild |
| ISR | SSG + background regeneration | A cache hit equals SSG; when stale, the old HTML is served while the server regenerates behind it |
| Streaming | Stream the shell, then the chunks | TTFB is independent of the API time. Each chunk hydrates selectively |
The timing model is an educational approximation, not a measurement tool. The constants live in src/engine/primitives.ts.
Running locally
pnpm install --frozen-lockfile
pnpm dev        # http://localhost:3000
pnpm test       # engine and timeline unit tests
pnpm build
The GIF and screenshots in this README can be regenerated with pnpm media after pnpm exec playwright install chromium (output in docs/media/).
Requires Node.js 20 or newer and pnpm 10. If pnpm is missing, install it with corepack enable or npm install -g pnpm@10.
Structure
src/engine/ — pure simulation engine with no React dependency. buildScenario(mode, params) produces packets, events and metrics, and stateAt(scenario, now) drives every view.src/components/simulator/ — timeline, player, virtual browser, metrics panel, parameter panelsrc/content/ — narration text plus mode and metric descriptionsdocs/ — plan summary (plan.md) and the concept reference (rendering-guide.md, Korean)
Deployment
The app is a static export (output: 'export'), so it needs no server. Every push to main runs .github/workflows/pages.yml, which builds the site with BASE_PATH=/SSR-Visualizer and publishes out/ to GitHub Pages.
Roadmap
- Compare view: play several modes side by side with the same parameters
- Hydration deep dive, Streaming / Selective Hydration view, ISR cache simulator